Bangsamoro’s Cultural Treasure
Economic Strengths
- Agriculture (rice, corn, coconut)
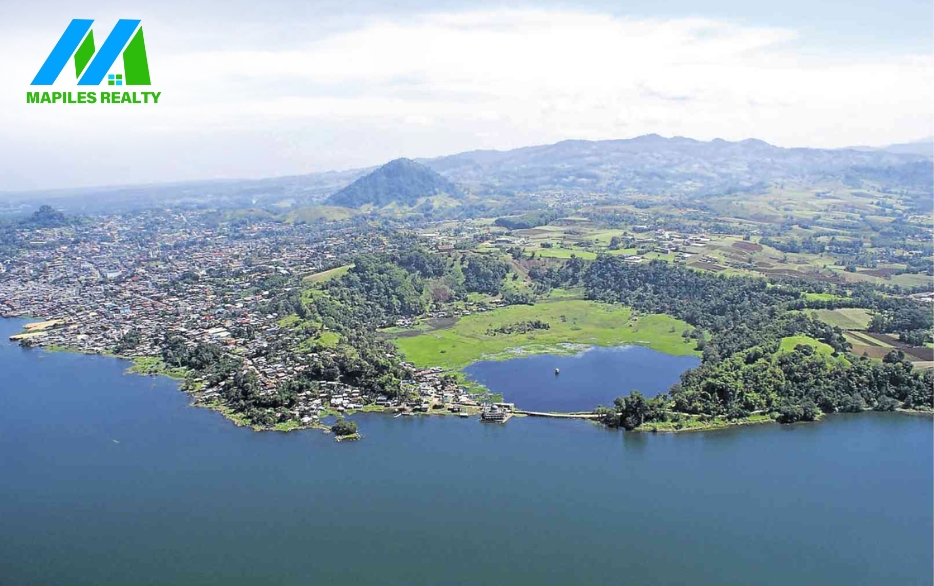
- Fishing and aquaculture (Lake Lanao)
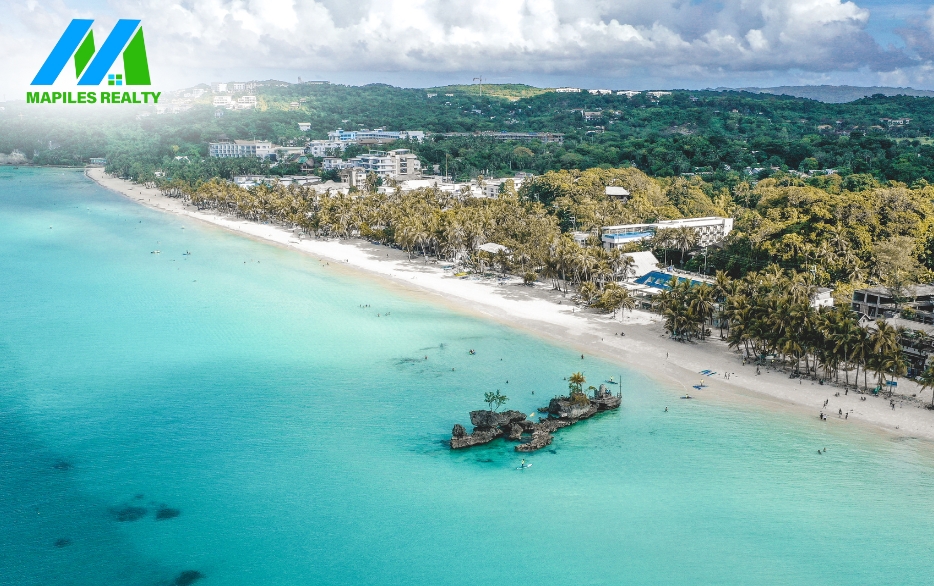
- Tourism (natural attractions, cultural heritage)
- Handicrafts (wood carving, weaving)
Demographic Advantages
- Young population (42.66% aged 14 and below)
- Growing workforce (55.91% aged 15-64)
- Median age: 18
Key Attractions
- Marawi City (capital)
- Lake Lanao (largest lake in Mindanao)
- Tugaya (wood carving, weaving hub)
- Islamic Center of the Philippines (cultural significance)
Opportunities
- Agricultural modernization
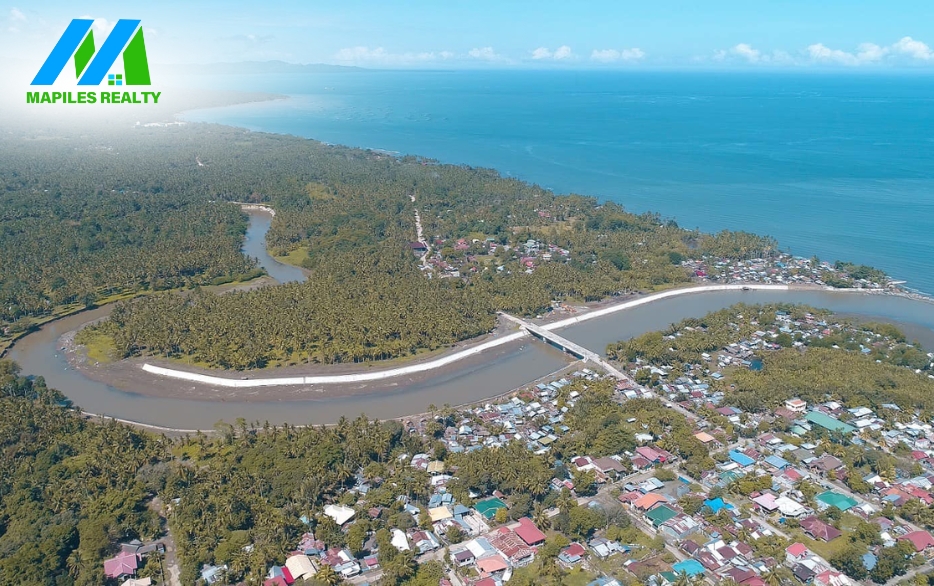
- Eco-tourism development
- Infrastructure upgrades (roads, bridges)
- Vocational training programs
Challenges
- Peace and security
- Poverty reduction
- Infrastructure limitations
- Cultural preservation
Why Invest in Lanao del Sur?
Lanao del Sur offers:
- Strategic location
- Rich cultural heritage
- Natural attractions
- Skilled workforce
- Government support
Investors seeking sustainable growth and returns will find Lanao del Sur an attractive destination.
| Name | City/ Municipality | Population (2020) | Population (2015) | Annual Population Growth Rate (2015‑2020) | Area (km2) | Density (2020), per km2 | Brgy count |
|---|---|---|---|---|---|---|---|
| Amai Manabilang | municipality | 12,124 | 10,401 | 3.28% | 544.10 | 22 | 17 |
| Bacolod-Kalawi | municipality | 23,129 | 20,841 | 2.22% | 491.57 | 47 | 26 |
| Balabagan | municipality | 29,863 | 26,819 | 2.29% | 230.00 | 130 | 27 |
| Balindong | municipality | 32,573 | 29,180 | 2.34% | 453.94 | 72 | 38 |
| Bayang | municipality | 28,023 | 23,965 | 3.35% | 230.00 | 122 | 49 |
| Binidayan | municipality | 25,965 | 22,079 | 3.47% | 189.58 | 137 | 26 |
| Buadiposo-Buntong | municipality | 18,046 | 16,130 | 2.39% | 215.00 | 84 | 33 |
| Bubong | municipality | 26,514 | 22,336 | 3.68% | 798.50 | 33 | 36 |
| Butig | municipality | 22,768 | 19,302 | 3.54% | 331.49 | 69 | 16 |
| Calanogas | municipality | 14,985 | 13,750 | 1.83% | 195.00 | 77 | 17 |
| Ditsaan-Ramain | municipality | 24,406 | 22,299 | 1.92% | 527.98 | 46 | 35 |
| Ganassi | municipality | 30,802 | 23,016 | 6.33% | 431.96 | 71 | 32 |
| Kapai | municipality | 20,581 | 18,894 | 1.82% | 398.50 | 52 | 20 |
| Kapatagan | municipality | 20,498 | 15,521 | 6.03% | 288.13 | 71 | 15 |
| Lumba-Bayabao | municipality | 45,909 | 36,151 | 5.16% | 698.07 | 66 | 38 |
| Lumbaca-Unayan | municipality | 8,131 | 7,260 | 2.41% | 160.23 | 51 | 9 |
| Lumbatan | municipality | 22,780 | 19,105 | 3.77% | 158.34 | 144 | 21 |
| Lumbayanague | municipality | 19,091 | 16,372 | 3.29% | 302.18 | 63 | 22 |
| Madalum | municipality | 26,478 | 23,127 | 2.89% | 860.00 | 31 | 37 |
| Madamba | municipality | 22,050 | 17,756 | 4.67% | 691.00 | 32 | 24 |
| Maguing | municipality | 30,436 | 24,531 | 4.65% | 615.04 | 49 | 34 |
| Malabang | municipality | 49,088 | 43,957 | 2.35% | 198.10 | 248 | 37 |
| Marantao | municipality | 37,763 | 32,974 | 2.90% | 660.00 | 57 | 34 |
| Marawi | city (CC), capital | 207,010 | 201,785 | 0.54% | 87.55 | 2,364 | 96 |
| Marogong | municipality | 30,118 | 21,319 | 7.55% | 365.00 | 83 | 24 |
| Masiu | municipality | 33,580 | 29,176 | 3.00% | 170.00 | 198 | 35 |
| Mulondo | municipality | 19,932 | 16,067 | 4.64% | 458.67 | 43 | 26 |
| Pagayawan | municipality | 15,057 | 13,139 | 2.91% | 218.00 | 69 | 18 |
| Piagapo | municipality | 30,132 | 25,440 | 3.63% | 340.07 | 89 | 37 |
| Picong | municipality | 18,907 | 16,615 | 2.76% | 277.56 | 68 | 19 |
| Poona Bayabao | municipality | 31,141 | 22,227 | 7.36% | 280.00 | 111 | 25 |
| Pualas | municipality | 14,526 | 12,866 | 2.59% | 242.34 | 60 | 23 |
| Saguiaran | municipality | 26,712 | 24,619 | 1.73% | 182.89 | 146 | 30 |
| Sultan Dumalondong | municipality | 12,500 | 11,298 | 2.15% | 51.35 | 243 | 7 |
| Tagoloan II | municipality | 12,602 | 11,169 | 2.57% | 481.45 | 26 | 19 |
| Tamparan | municipality | 32,074 | 25,874 | 4.63% | 520.52 | 62 | 44 |
| Taraka | municipality | 27,184 | 23,644 | 2.98% | 435.40 | 62 | 43 |
| Tubaran | municipality | 16,896 | 14,749 | 2.90% | 435.00 | 39 | 21 |
| Tugaya | municipality | 24,778 | 23,814 | 0.84% | 355.76 | 70 | 23 |
| Wao | municipality | 50,366 | 45,862 | 1.99% | 485.24 | 104 | 26 |
| Lanao del Sur Total | 1,195,518 | 1,045,429 | 2.86% | 15,055.51 | 79 | 1,159 | |
Economy
| Fiscal Year | Annual Regular Income | Change |
|---|---|---|
| 2009 | 1,160,785,513.78 | – |
| 2010 | 1,276,007,235.85 | 9.93% |
| 2011 | 1,366,905,862.54 | 7.12% |
| 2012 | 1,302,922,835.81 | -4.68% |
| 2013 | 1,330,868,364.19 | 2.14% |
| 2014 | 1,460,872,916.08 | 9.77% |
| 2015 | 1,672,478,628.58 | 14.48% |
| 2016 | 1,842,180,471.29 | 10.15% |
| End notes:Annual Regular Income = Locally Sourced Revenue + Internal Revenue Allotment (IRA) Current Year + Other Shares from National Tax CollectionLocally Sourced Revenue = Real Property Tax (General Fund) + Tax on Business + Other Taxes + Regulatory Fees + Service/User Charges + Receipts from Economic Enterprises | ||
Tourism
Lanao del Sur promises immersive cultural tourism experiences for travelers seeking to explore the Philippines’ diverse heritage. Its vibrant festivals, traditional architecture, and warm hospitality offer unique attractions for those looking to embrace local traditions.
Visitors to Lanao del Sur can immerse themselves in the rich Maranao culture, savor local delicacies, and participate in colorful celebrations. The province’s potential as a cultural tourism destination is an exciting discovery for those looking to experience the heart of Filipino culture.