Bicol’s Hidden Gem
Economic Strengths
- Agriculture (cattle ranching, rice, coconut)
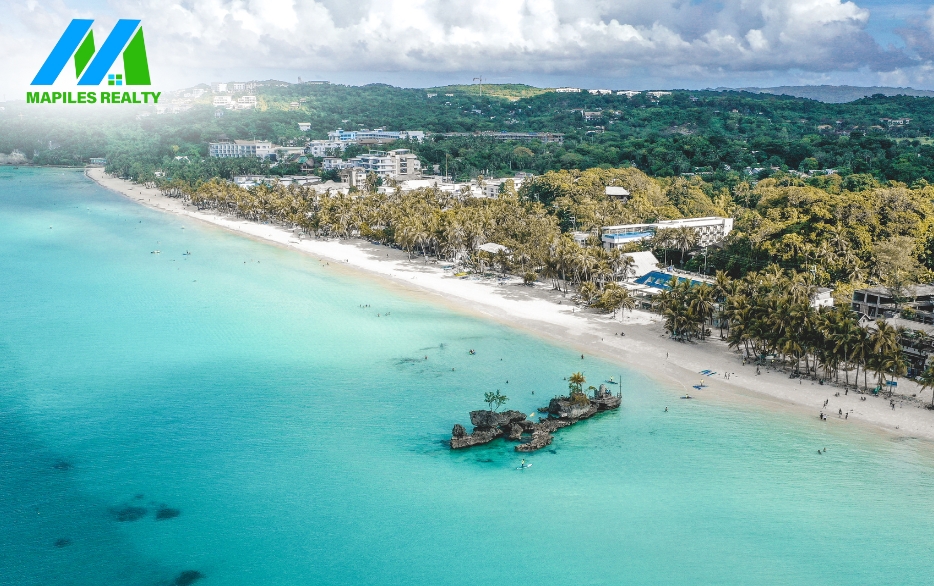
- Tourism (beaches, diving, caves)
- Fishing and aquaculture
- Mining (copper, gold)
Demographic Advantages
- Young population (40.52% aged 14 and below)
- Growing workforce (54.65% aged 15-64)
- Median age: 19
Key Attractions
- Masbate Island (beaches, mountains)
- Masbate City (rodeo capital)
- Ticao Island (caves, coral reefs)
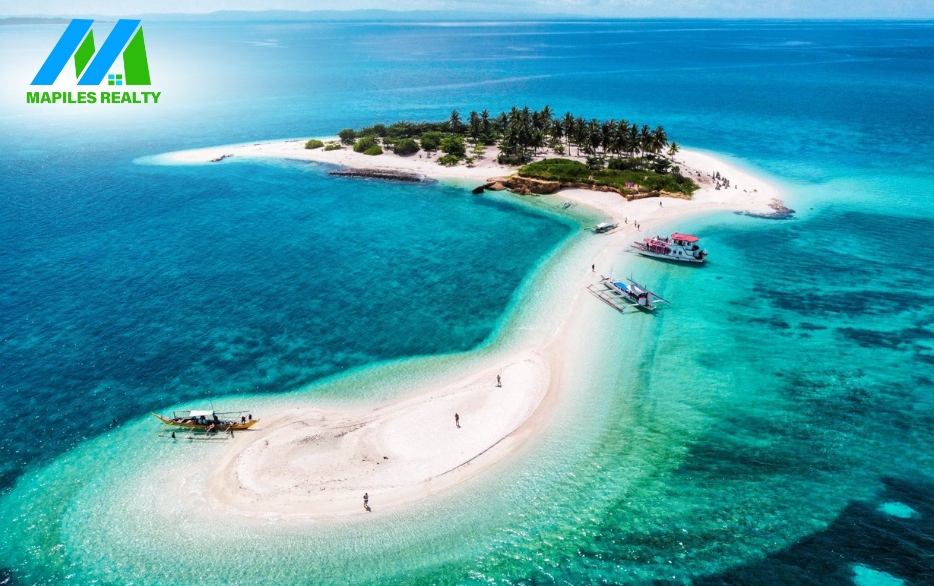
- Burias Island (diving, snorkeling)
Opportunities
- Eco-tourism development
- Agricultural modernization
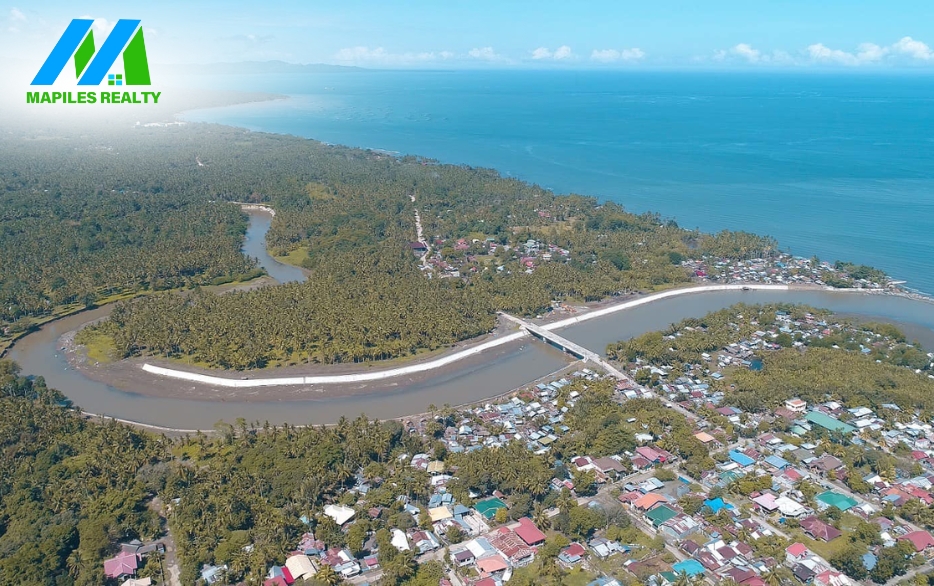
- Infrastructure upgrades (ports, roads)
- Livestock industry expansion
Why Invest in Masbate?
Masbate offers natural beauty, economic potential and strategic location. With government support, skilled workforce and growing infrastructure, the province invites investors seeking sustainable growth.
| Name | City/ Municipality | Population (2020) | Population (2015) | Annual Population Growth Rate (2015‑2020) | Area (km2) | Density (2020), per km2 | Brgy count |
|---|---|---|---|---|---|---|---|
| Aroroy | municipality | 88,351 | 86,168 | 0.53% | 440.30 | 201 | 41 |
| Baleno | municipality | 28,855 | 26,096 | 2.14% | 204.38 | 141 | 24 |
| Balud | municipality | 40,155 | 38,124 | 1.10% | 231.00 | 174 | 32 |
| Batuan | municipality | 14,610 | 15,086 | -0.67% | 56.28 | 260 | 14 |
| Cataingan | municipality | 50,623 | 50,327 | 0.12% | 191.64 | 264 | 36 |
| Cawayan | municipality | 69,265 | 67,033 | 0.69% | 260.19 | 266 | 37 |
| Claveria | municipality | 42,142 | 43,693 | -0.76% | 182.98 | 230 | 22 |
| Dimasalang | municipality | 24,909 | 26,192 | -1.05% | 148.07 | 168 | 20 |
| Esperanza | municipality | 17,534 | 18,568 | -1.20% | 67.49 | 260 | 20 |
| Mandaon | municipality | 44,122 | 41,262 | 1.42% | 319.15 | 138 | 26 |
| Masbate City | city (CC), capital | 104,522 | 95,389 | 1.94% | 188.00 | 556 | 30 |
| Milagros | municipality | 57,538 | 57,473 | 0.02% | 565.30 | 102 | 27 |
| Mobo | municipality | 40,823 | 38,813 | 1.07% | 143.47 | 285 | 29 |
| Monreal | municipality | 25,164 | 26,614 | -1.17% | 128.67 | 196 | 11 |
| Palanas | municipality | 27,322 | 26,222 | 0.87% | 119.53 | 229 | 24 |
| Pio V. Corpuz | municipality | 23,744 | 23,236 | 0.46% | 89.33 | 266 | 18 |
| Placer | municipality | 56,340 | 55,826 | 0.19% | 193.03 | 292 | 35 |
| San Fernando | municipality | 21,600 | 23,057 | -1.36% | 77.50 | 279 | 26 |
| San Jacinto | municipality | 29,686 | 30,372 | -0.48% | 122.40 | 243 | 21 |
| San Pascual | municipality | 44,449 | 46,674 | -1.02% | 246.65 | 180 | 22 |
| Uson | municipality | 57,166 | 56,168 | 0.37% | 163.20 | 350 | 35 |
| Masbate Total | 908,920 | 892,393 | 0.39% | 4,138.56 | 220 | 550 | |
Economy
| Fiscal Year | Annual Regular Income | Change |
|---|---|---|
| 2009 | 722,301,210.00 | – |
| 2010 | 774,777,695.02 | 7.27% |
| 2011 | 851,429,005.20 | 9.89% |
| 2012 | 821,145,304.73 | -3.56% |
| 2013 | 909,142,044.68 | 10.72% |
| 2014 | 1,028,252,346.97 | 13.10% |
| 2015 | 1,150,695,772.65 | 11.91% |
| 2016 | 1,283,771,368.40 | 11.56% |
| End notes:Annual Regular Income = Locally Sourced Revenue + Internal Revenue Allotment (IRA) Current Year + Other Shares from National Tax CollectionLocally Sourced Revenue = Real Property Tax (General Fund) + Tax on Business + Other Taxes + Regulatory Fees + Service/User Charges + Receipts from Economic Enterprises | ||
Tourism
Masbate’s tourism industry thrives on its natural beauty and vibrant culture. The province boasts unspoiled beaches, diving spots teeming with marine life, and lush mountains waiting to be explored.
Tourists can witness the exhilarating Rodeo Masbateño, a cowboy festival that showcases the province’s ranching heritage. Nature lovers can explore Ticao Island, swim with whale sharks, or simply unwind on the pristine shores of Burias Island.
The province’s cuisine, with its seafood delicacies and Bicolano flavors, offers a culinary adventure that captivates the taste buds.