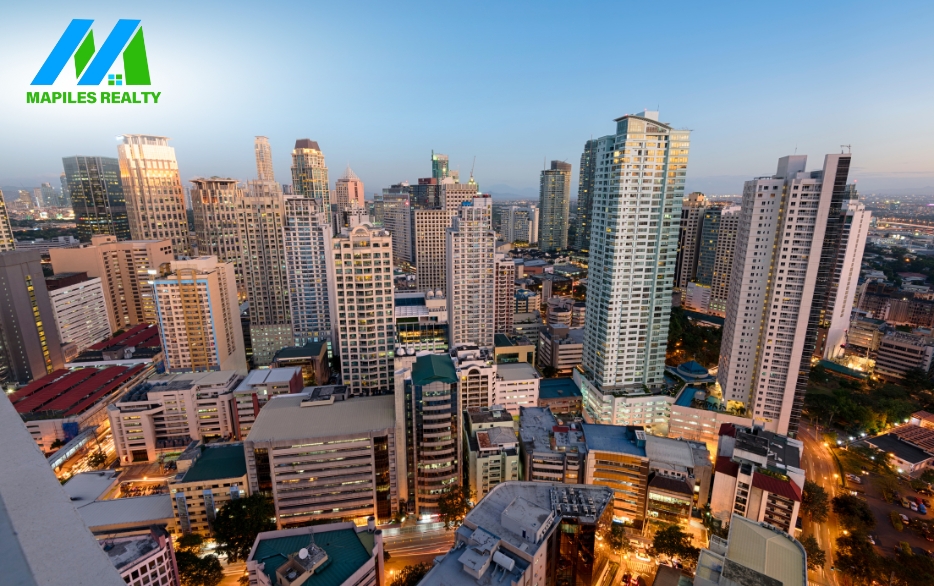
Philippines’ Economic Powerhouse
Economic Strengths
- Financial hub (Makati, Bonifacio Global City)
- Manufacturing (electronics, automotive)
- Services (IT-BPO, tourism)
- Logistics and transportation (ports, airports)
Demographic Advantages
- Large workforce (13.5 million)
- Young population (median age: 24)
- Highly urbanized cities
Key Attractions
- Manila (capital city)
- Intramuros (historical site)
- Fort Bonifacio (commercial hub)
- Manila Ocean Park (tourist attraction)
Opportunities
- Infrastructure development (mass transit, roads)
- IT-BPO industry growth
- Tourism expansion
- Sustainable urban planning
Challenges
- Congestion and traffic
- Housing and affordability
- Environmental concerns
- Public health and sanitation
Why Invest in Metro Manila?
Metro Manila offers unparalleled economic opportunities, a skilled workforce and strategic location. Despite challenges, government initiatives and infrastructure development make it an attractive destination for investors seeking growth and returns.
| Name | City/ Municipality | Population (2020) | Population (2015) | Annual Population Growth Rate (2015‑2020) | Area (km2) | Density (2020), per km2 | Brgy count |
|---|---|---|---|---|---|---|---|
| Caloocan | city (HUC) | 1,661,584 | 1,583,978 | 1.01% | 55.80 | 29,777 | 188 |
| Las Piñas | city (HUC) | 606,293 | 588,894 | 0.61% | 32.69 | 18,547 | 20 |
| Makati | city (HUC) | 629,616 | 582,602 | 1.65% | 21.57 | 29,189 | 33 |
| Malabon | city (HUC) | 380,522 | 365,525 | 0.85% | 15.71 | 24,222 | 21 |
| Mandaluyong | city (HUC) | 425,758 | 386,276 | 2.07% | 9.29 | 45,830 | 27 |
| Manila | city (HUC), capital, regional center | 1,846,513 | 1,780,148 | 0.77% | 24.98 | 73,920 | 897 |
| Marikina | city (HUC) | 456,059 | 450,741 | 0.25% | 21.52 | 21,192 | 16 |
| Muntinlupa | city (HUC) | 543,445 | 504,509 | 1.58% | 39.75 | 13,672 | 9 |
| Navotas | city (HUC) | 247,543 | 249,463 | -0.16% | 8.94 | 27,689 | 18 |
| Parañaque | city (HUC) | 689,992 | 665,822 | 0.75% | 46.57 | 14,816 | 16 |
| Pasay | city (HUC) | 440,656 | 416,522 | 1.19% | 13.97 | 31,543 | 201 |
| Pasig | city (HUC) | 803,159 | 755,300 | 1.30% | 48.46 | 16,574 | 30 |
| Pateros | mun | 65,227 | 63,840 | 0.45% | 10.40 | 6,272 | 10 |
| Quezon City | city (HUC) | 2,960,048 | 2,936,116 | 0.17% | 171.71 | 17,239 | 142 |
| San Juan | city (HUC) | 126,347 | 122,180 | 0.71% | 5.95 | 21,235 | 21 |
| Taguig | city (HUC) | 886,722 | 804,915 | 2.06% | 45.21 | 19,613 | 28 |
| Valenzuela | city (HUC) | 714,978 | 620,422 | 3.03% | 47.02 | 15,206 | 33 |
| National Capital Region Total | 13,484,462 | 12,877,253 | 0.97% | 619.54 | 21,765 | 1,710 | |
Economy
As of 2022, the Gross Domestic Product (GDP) per capita for the National Capital Region (NCR) of the Philippines stood at 487,932.75 PHP, showing a notable increase from the previous year when it was 440,885.46 PHP. This data, reported by the Philippine Statistics Authority, is updated annually and reflects the economic well-being of the population in the NCR.
Over the period from December 2000 to 2022, the GDP per capita in the NCR has shown a significant upward trend, with an average of 267,953.51 PHP. The data fluctuated during this time, hitting a low of 124,217.46 PHP in 2000 and reaching its peak at 487,932.75 PHP in 2022. This data provides valuable insights into the economic performance and living standards in the National Capital Region of the Philippines.
Tourism
Metro Manila’s tourism industry offers a tapestry of experiences that blend history, culture, and contemporary excitement. Visitors can explore historical sites like Intramuros, savor the rich flavors of Filipino cuisine, and immerse themselves in vibrant festivals and the city’s dynamic arts scene.
The city’s modernity coexists with its heritage, creating a unique juxtaposition of experiences for tourists. The Manila Bay waterfront, bustling shopping districts, and entertainment hubs offer a diverse range of attractions.