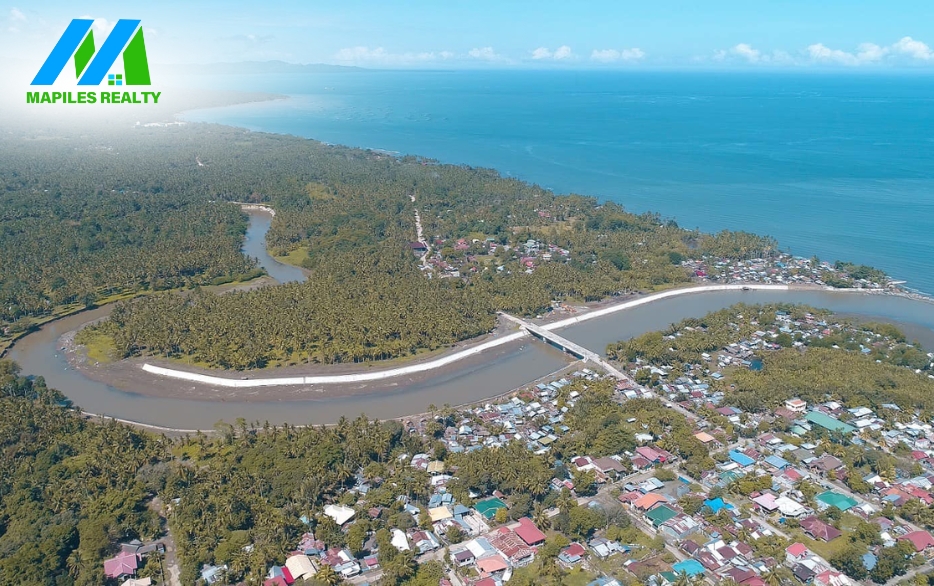

A Thriving Hub in Calabarzon
Quezon Province, named after Philippine President Manuel L. Quezon, boasts stunning landscapes, rich heritage and economic vitality. Here’s why it’s an attractive destination:
Demographic Highlights
- Young population (33.14% aged 14 and below)
- Growing workforce (62.05% aged 15-64)
- Median age: 24
Economic Strengths
- Agriculture (coconut, rice, citrus fruits)
- Tourism (beaches, waterfalls, historic sites)
- Manufacturing (food processing, furniture)
- Real estate development (residential, commercial)
Key Infrastructure
- Quezon Provincial Hospital
- Major roads (Quezon-Eastern Highway, Bondoc Peninsula Highway)
- Seaports (Lucban, Infanta)
Opportunities
- Eco-tourism projects
- Agri-business investments
- Vocational training programs
- Renewable energy initiatives
Why Invest in Quezon?
- Favourable business climate
- Abundant natural resources
- Skilled workforce
- Strategic location
- Rich cultural heritage
Quezon Province offers a unique blend of progress and tradition, making it an ideal destination for investors, tourists and residents.
| Name | City/ Municipality | Population (2020) | Population (2015) | Annual Population Growth Rate (2015‑2020) | Area (km2) | Density (2020), per km2 | Brgy count |
|---|---|---|---|---|---|---|---|
| Agdangan | municipality | 12,764 | 12,851 | -0.14% | 31.54 | 405 | 12 |
| Alabat | municipality | 15,936 | 15,630 | 0.41% | 57.61 | 277 | 19 |
| Atimonan | municipality | 64,260 | 63,432 | 0.27% | 239.66 | 268 | 42 |
| Buenavista | municipality | 31,160 | 30,047 | 0.77% | 161.35 | 193 | 37 |
| Burdeos | municipality | 24,644 | 26,760 | -1.72% | 199.82 | 123 | 13 |
| Calauag | municipality | 71,809 | 73,139 | -0.39% | 324.71 | 221 | 81 |
| Candelaria | municipality | 137,881 | 117,434 | 3.44% | 129.10 | 1,068 | 25 |
| Catanauan | municipality | 72,752 | 71,073 | 0.49% | 253.07 | 287 | 46 |
| Dolores | municipality | 32,514 | 28,891 | 2.52% | 62.60 | 519 | 16 |
| General Luna | municipality | 24,804 | 26,494 | -1.38% | 101.02 | 246 | 27 |
| General Nakar | municipality | 34,225 | 29,705 | 3.03% | 1,343.75 | 25 | 19 |
| Guinayangan | municipality | 44,045 | 45,155 | -0.52% | 214.12 | 206 | 54 |
| Gumaca | municipality | 71,942 | 73,877 | -0.56% | 189.65 | 379 | 59 |
| Infanta | municipality | 76,186 | 69,079 | 2.08% | 342.76 | 222 | 36 |
| Jomalig | municipality | 7,667 | 7,417 | 0.70% | 53.93 | 142 | 5 |
| Lopez | municipality | 94,657 | 95,167 | -0.11% | 355.38 | 266 | 95 |
| Lucban | municipality | 53,091 | 51,475 | 0.65% | 130.46 | 407 | 32 |
| Macalelon | municipality | 27,312 | 28,188 | -0.66% | 124.05 | 220 | 30 |
| Mauban | municipality | 71,081 | 63,819 | 2.29% | 415.98 | 171 | 40 |
| Mulanay | municipality | 55,576 | 53,123 | 0.95% | 420.00 | 132 | 28 |
| Padre Burgos | municipality | 23,488 | 22,460 | 0.95% | 69.10 | 340 | 22 |
| Pagbilao | municipality | 78,700 | 75,023 | 1.01% | 170.96 | 460 | 27 |
| Panukulan | municipality | 16,376 | 13,546 | 4.08% | 226.61 | 72 | 13 |
| Patnanungan | municipality | 15,052 | 14,606 | 0.64% | 139.20 | 108 | 6 |
| Perez | municipality | 12,767 | 12,173 | 1.01% | 57.46 | 222 | 14 |
| Pitogo | municipality | 22,798 | 23,019 | -0.20% | 73.39 | 311 | 39 |
| Plaridel | municipality | 10,129 | 10,935 | -1.60% | 18.19 | 557 | 9 |
| Polillo | municipality | 31,908 | 30,582 | 0.90% | 253.00 | 126 | 20 |
| Quezon | municipality | 15,886 | 15,228 | 0.89% | 71.22 | 223 | 24 |
| Real | municipality | 38,678 | 35,979 | 1.53% | 337.92 | 114 | 17 |
| Sampaloc | municipality | 13,629 | 13,907 | -0.42% | 104.78 | 130 | 14 |
| San Andres | municipality | 37,454 | 35,780 | 0.97% | 172.93 | 217 | 7 |
| San Antonio | municipality | 35,891 | 33,467 | 1.48% | 60.99 | 588 | 20 |
| San Francisco | municipality | 62,097 | 61,473 | 0.21% | 303.96 | 204 | 16 |
| San Narciso | municipality | 51,058 | 48,461 | 1.11% | 263.58 | 194 | 24 |
| Sariaya | municipality | 161,868 | 148,980 | 1.76% | 212.16 | 763 | 43 |
| Tagkawayan | municipality | 54,003 | 51,832 | 0.87% | 534.35 | 101 | 45 |
| Tayabas | city (CC) | 112,658 | 99,779 | 2.59% | 230.95 | 488 | 66 |
| Tiaong | municipality | 106,265 | 99,712 | 1.35% | 168.38 | 631 | 31 |
| Unisan | municipality | 25,448 | 26,884 | -1.15% | 124.15 | 205 | 36 |
| Quezon Total | 1,950,459 | 1,856,582 | 1.04% | 8,743.84 | 223 | 1,209 | |
Economy
| Fiscal Year | Annual Regular Income | Change |
|---|---|---|
| 2009 | 1,511,702,637.95 | – |
| 2010 | 1,619,396,001.74 | 7.12% |
| 2011 | 1,793,491,104.29 | 10.75% |
| 2012 | 1,752,604,253.48 | -2.28% |
| 2013 | 1,915,958,003.09 | 9.32% |
| 2014 | 2,151,782,804.54 | 12.31% |
| 2015 | 2,699,870,640.54 | 25.47% |
| 2016 | 2,743,542,008.00 | 1.62% |
| End notes:Annual Regular Income = Locally Sourced Revenue + Internal Revenue Allotment (IRA) Current Year + Other Shares from National Tax CollectionLocally Sourced Revenue = Real Property Tax (General Fund) + Tax on Business + Other Taxes + Regulatory Fees + Service/User Charges + Receipts from Economic Enterprises | ||
Tourism
Quezon Province in the Philippines offers a diverse range of tourism experiences. Visitors can enjoy pristine beaches, explore lush forests and mountains, delve into the province’s history and culture in heritage towns, participate in festivals, savor local cuisine, and discover religious sites. Eco-tourism, agri-tourism, and beach resorts are also prevalent, providing a variety of activities for travelers interested in nature, adventure, and relaxation. Quezon’s rich offerings make it an appealing destination for a wide range of interests.