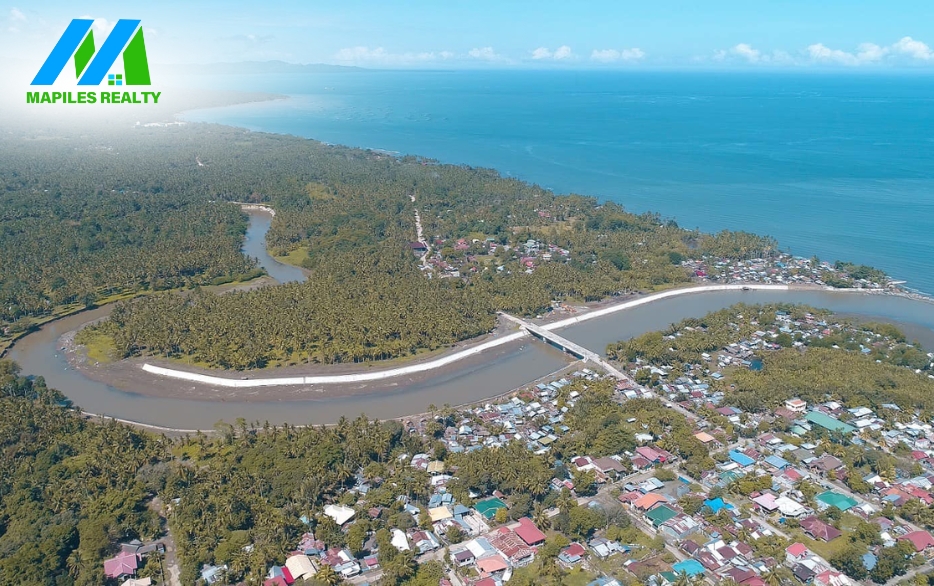

Romblon Province’s strategic location and demographic dynamics position it for growth:
Economic Pillars
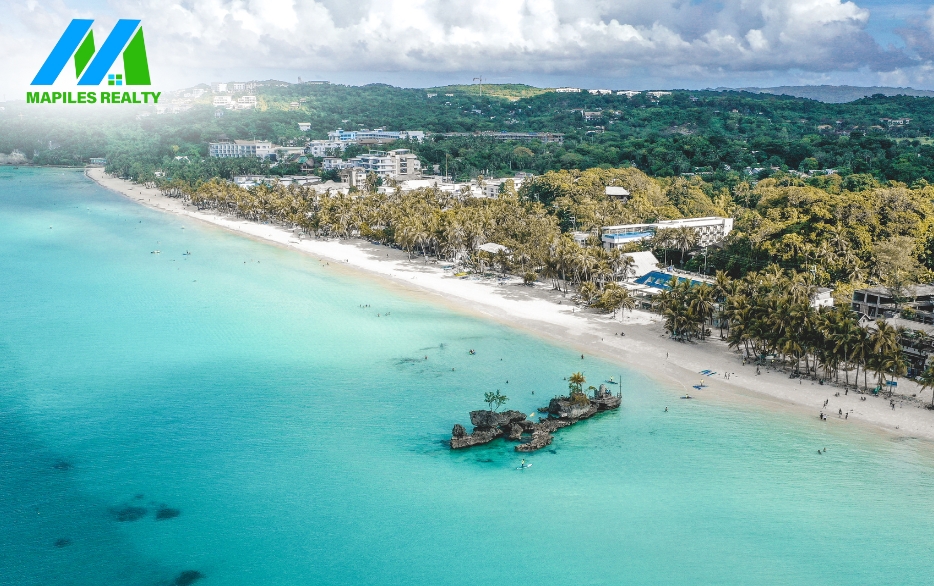
- Tourism: Leveraging island beauty, crystal-clear waters and historic sites.
- Fishing and Aquaculture: Capitalizing on rich marine resources.
- Sustainable Agriculture: Developing coconut, rice and vegetable industries.
Development Opportunities
- Island-hopping infrastructure development
- Eco-friendly resorts and accommodations
- Vocational training for tourism and agriculture
- Renewable energy initiatives
- Heritage preservation and cultural tourism
Key Statistics
- Population growth rate: 1.4% (2020 census)
- Labor force: 171,181 (15-64 years old)
- Median age: 23
Investing in Romblon
Romblon’s unique blend of natural beauty, strategic location and young population makes it an attractive investment destination.
| Name | City/ Municipality | Population (2020) | Population (2015) | Annual Population Growth Rate (2015‑2020) | Area (km2) | Density (2020), per km2 | Brgy count |
|---|---|---|---|---|---|---|---|
| Alcantara | municipality | 17,171 | 16,351 | 1.04% | 60.12 | 286 | 12 |
| Banton | municipality | 5,737 | 5,536 | 0.75% | 32.48 | 177 | 17 |
| Cajidiocan | municipality | 23,259 | 21,861 | 1.31% | 201.85 | 115 | 14 |
| Calatrava | municipality | 11,342 | 10,275 | 2.10% | 86.70 | 131 | 7 |
| Concepcion | municipality | 3,561 | 4,037 | -2.61% | 19.82 | 180 | 9 |
| Corcuera | municipality | 10,112 | 10,283 | -0.35% | 28.53 | 354 | 15 |
| Ferrol | municipality | 8,005 | 6,964 | 2.98% | 26.72 | 300 | 6 |
| Looc | municipality | 21,799 | 22,262 | -0.44% | 132.82 | 164 | 12 |
| Magdiwang | municipality | 15,385 | 14,142 | 1.79% | 100.75 | 153 | 9 |
| Odiongan | municipality | 49,284 | 45,367 | 1.76% | 185.67 | 265 | 25 |
| Romblon | municipality, capital | 40,554 | 38,758 | 0.96% | 86.87 | 467 | 31 |
| San Agustin | municipality | 24,115 | 22,598 | 1.38% | 140.48 | 172 | 15 |
| San Andres | municipality | 15,940 | 15,589 | 0.47% | 112.00 | 142 | 13 |
| San Fernando | municipality | 24,171 | 23,271 | 0.80% | 196.87 | 123 | 12 |
| San Jose | municipality | 11,759 | 10,881 | 1.65% | 22.05 | 533 | 5 |
| Santa Fe | municipality | 17,802 | 16,098 | 2.14% | 63.52 | 280 | 11 |
| Santa Maria | municipality | 8,989 | 8,508 | 1.16% | 36.20 | 248 | 6 |
| Romblon Total | 308,985 | 292,781 | 1.14% | 1,533.45 | 201 | 219 | |
Economy
| Fiscal Year | Annual Regular Income | Change |
|---|---|---|
| 2009 | 197,304,527.82 | – |
| 2010 | 424,393,321.48 | 115.10% |
| 2011 | 460,281,123.07 | 8.46% |
| 2012 | 446,748,874.25 | -2.94% |
| 2013 | 486,739,853.90 | 8.95% |
| 2014 | 546,043,963.01 | 12.18% |
| 2015 | 625,048,626.99 | 14.47% |
| 2016 | 692,248,130.71 | 10.75% |
| End notes:Annual Regular Income = Locally Sourced Revenue + Internal Revenue Allotment (IRA) Current Year + Other Shares from National Tax CollectionLocally Sourced Revenue = Real Property Tax (General Fund) + Tax on Business + Other Taxes + Regulatory Fees + Service/User Charges + Receipts from Economic Enterprises | ||
Tourism
Romblon’s tourism industry thrives on its world-renowned marble quarries, cultural treasures, and serene ambiance. The province boasts enchanting destinations like the iconic marble quarries of Romblon Island, pristine white-sand beaches, and captivating diving spots teeming with marine life.
Nature enthusiasts can explore captivating caves, embark on treks through lush forests, or savor local delicacies that reflect Romblon’s unique flavors. Romblon’s cuisine offers a culinary adventure that tantalizes the senses.