
Located in Central Luzon, Zambales boasts:
Key Attractions
- Rich cultural heritage
- Diverse natural resources
- Growing economy
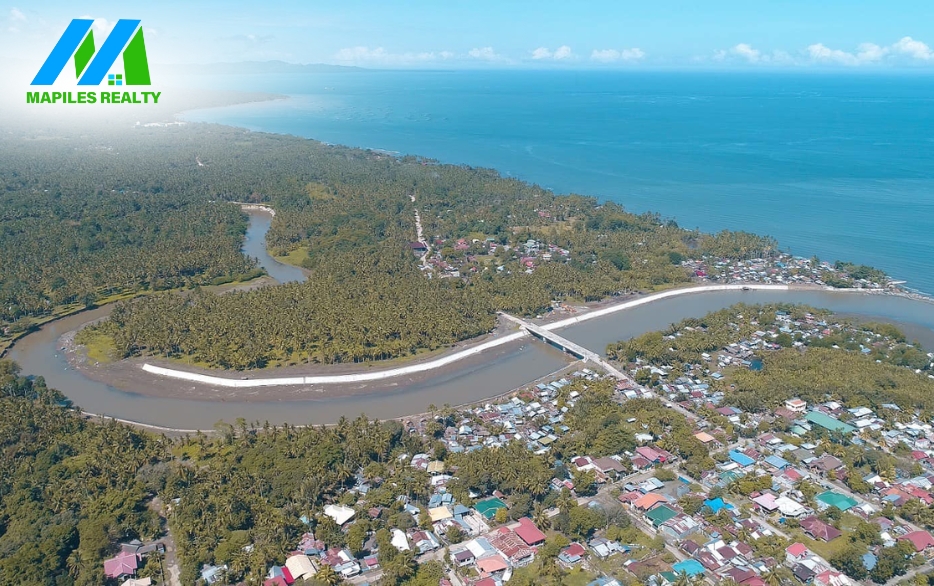
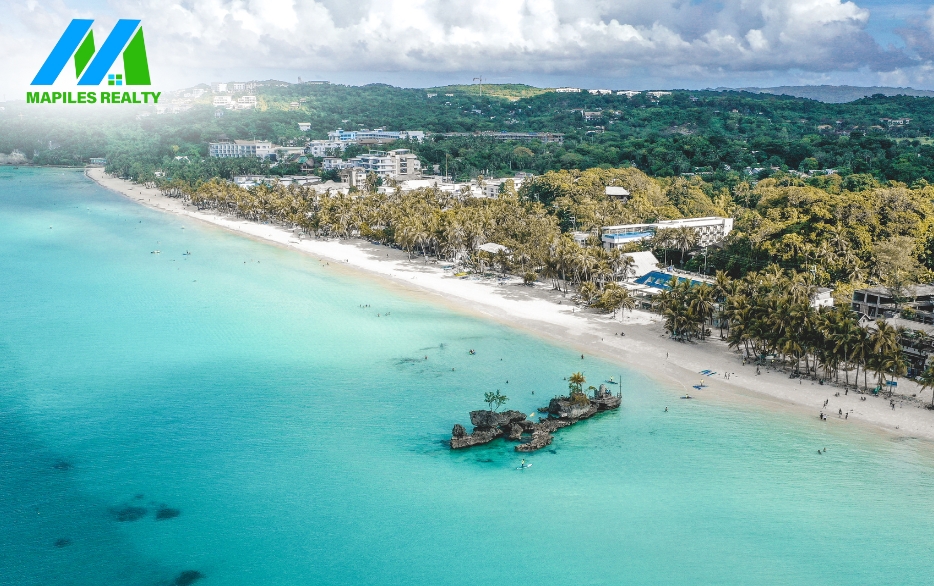
- Stunning South China Sea coastline
- Accessible location
Demographics (2015 Census)
- Young population: 30.99% aged 14 and below
- Workforce hub: 63.78% aged 15-64
- Dependency ratio: 49 youth dependents per 100 working-age individuals
- Median age: 25
Investment Opportunities
- Tourism infrastructure
- Agriculture and fisheries
- Mining and manufacturing
- Renewable energy
- Education and training institutions
Why Invest in Zambales?
- Strategic location
- Growing economy
- Abundant natural resources
- Diverse cultural heritage
- Supportive local government
Zambales offers a unique blend of natural beauty, economic growth and cultural richness, making it an attractive destination for tourists, investors and entrepreneurs.
| Name | City/ Municipality | Population (2020) | Population (2015) | Annual Population Growth Rate (2015‑2020) | Area (km2) | Density (2020), per km2 | Brgy count |
|---|---|---|---|---|---|---|---|
| Botolan | municipality | 66,739 | 57,707 | 3.11% | 735.28 | 91 | 31 |
| Cabangan | municipality | 28,118 | 25,163 | 2.37% | 175.29 | 160 | 22 |
| Candelaria | municipality | 30,263 | 27,174 | 2.29% | 333.59 | 91 | 16 |
| Castillejos | municipality | 67,889 | 64,841 | 0.97% | 92.99 | 730 | 14 |
| Iba | municipality, capital | 55,581 | 50,506 | 2.04% | 153.38 | 362 | 14 |
| Masinloc | municipality | 54,529 | 47,719 | 2.85% | 316.02 | 173 | 13 |
| Palauig | municipality | 39,784 | 34,947 | 2.77% | 310.00 | 128 | 19 |
| San Antonio | municipality | 37,450 | 34,661 | 1.64% | 188.12 | 199 | 14 |
| San Felipe | municipality | 25,033 | 23,183 | 1.63% | 111.60 | 224 | 11 |
| San Marcelino | municipality | 37,719 | 33,665 | 2.42% | 416.86 | 90 | 18 |
| San Narciso | municipality | 30,759 | 28,360 | 1.72% | 71.60 | 430 | 17 |
| Santa Cruz | municipality | 63,839 | 58,151 | 1.98% | 438.46 | 146 | 25 |
| Subic | municipality | 111,912 | 104,771 | 1.40% | 287.16 | 390 | 16 |
| Zambales Total | 649,615 | 590,848 | 2.02% | 3,630.35 | 179 | 230 | |
Economy
| Fiscal Year | Annual Regular Income | Change |
|---|---|---|
| 2009 | 643,966,391.25 | – |
| 2010 | 655,308,121.31 | 1.76% |
| 2011 | 741,893,718.42 | 13.21% |
| 2012 | 729,926,753.17 | -1.61% |
| 2013 | 786,447,180.36 | 7.74% |
| 2014 | 894,062,431.90 | 13.68% |
| 2015 | 995,974,062.41 | 11.40% |
| 2016 | 1,098,931,241.67 | 10.34% |
| End notes:Annual Regular Income = Locally Sourced Revenue + Internal Revenue Allotment (IRA) Current Year + Other Shares from National Tax CollectionLocally Sourced Revenue = Real Property Tax (General Fund) + Tax on Business + Other Taxes + Regulatory Fees + Service/User Charges + Receipts from Economic Enterprises | ||
Tourism
This is another significant contributor to Zambales’ economy, with its stunning beaches, coral reefs, and other natural attractions drawing in visitors from all over the world. The province is home to several popular destinations, such as the Subic Bay Freeport Zone, the Zambales Mountain Range, and the Anawangin Cove.